Creating a free website status page using Uptime Robot
Uptime Robot provides free uptime/downtime monitoring for up to 50 websites. The API can be used to create a dynamic website status page.
July 2018
Website monitoring is an important (and often overlooked) aspect of maintaining a website. Getting alerts when a website is having issues allows you to get ahead of the problem and fix it as soon as possible. The last thing you want is a client telling you their website is down before you are even aware of the problem.
Luckily, there are many services providing uptime monitoring. In this article I will be covering the excellent Uptime Robot, which provides free monitoring for a generous 50 websites. As soon as a website goes down, you can be notified by email, Twitter, Slack, and many other services. It also provides an intuitive dashboard with many useful statistics.
As great as Uptime Robot is, it isn't feasible to provide a client with logins to another service to keep an eye on their website. This article shows how to utilise the API provided by Uptime Robot to create a nice dynamic status page, which can be placed directly on the website (domain/status.php for example). This could also be extended to send out monthly reports detailing uptime. This can help instil confidence in the client that the server you have chosen is working as it should, and that their yearly maintenance fees are going to good use.
Initial setup
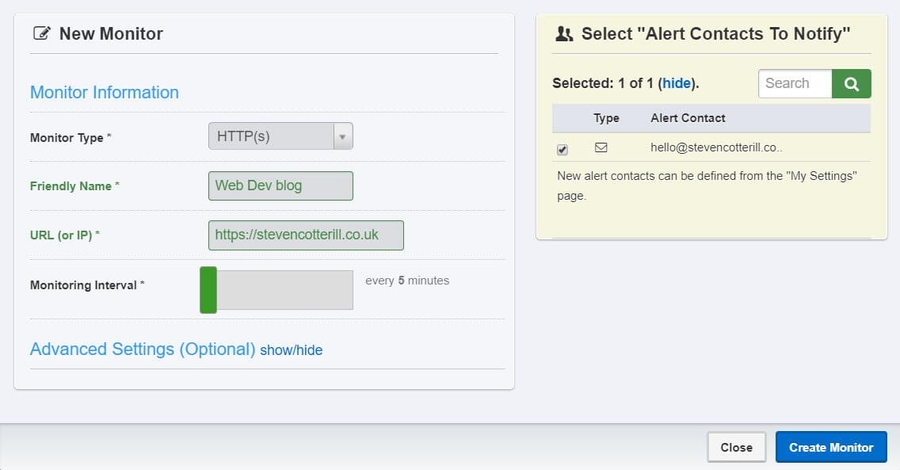
The first step is to get signed up here. Once your email has been verified, login to the dashboard and click the 'Add New Monitor' button. These are typically the settings I use, but customise them to fit your needs. Click 'Create Monitor' when you are happy with the config.
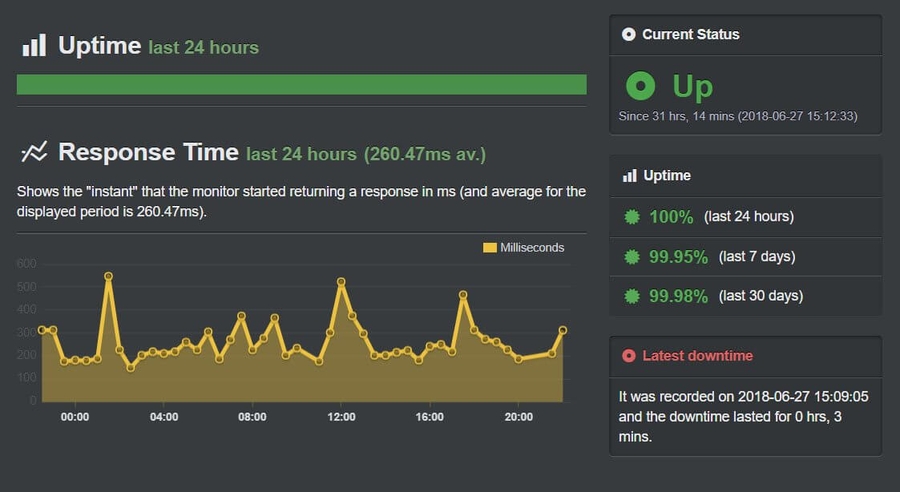
The website added will start being monitored right away. After a while, you will start to see stats such as these (my website is hosted by Netlify, highly recommended!):
As mentioned before; the above is great for developers/admins, but not so much for clients. Let's make a nicer status page.
Accessing the Uptime Robot API
The first step is to go to 'My Settings'. From here, navigate to 'Monitor-Specific API Keys' and search for the newly created monitor. This will provide an API key for this monitor/website. Copy this key somewhere as it will be needed soon enough.
The API Docs can be found here, with the 'getMonitors' method being the one we are interested in for the status page.
'This is a Swiss-Army knife type of a method for getting any information on monitors' - just what we need!
Now, lets get stuck into the code to get this up and running.
Using the API
One quick note; the API can be accessed using many different languages. I'm using PHP for this article. Code snippets are available for all the other languages in the docs.
Create a new file in your project folder named 'monitoring.php'. The first step is to add a variable with the unique API key of the monitor:
Now the request to the API needs to be created. These parameters can be adapted to fit your needs, but here are those being used:
- format=json: This lets the API know that it should return the response in the JSON file format
- logs=1: Return the logs for the monitor
- log_types=1: Return only downtime events. This parameter is not currently documented. I was made aware of this by the great support team at Uptime Robot
- all_time_uptime_ratio=1: Return the all-time uptime ratio for the monitor
Let's put the above together and build the request:
Now it's time to make the request to the API. I'm using cURL to do so. Don't worry about the code below, it won't need changed and is straight from the docs.
Next, use json_decode to decode the JSON response, and enable it to be easily usable by PHP:
print_r can be used to view the contents of the response to see if everything is looking good. See the object returned below for me:
This object has all the useful information we need and mirrors what is shown in the Uptime Robot dashboard.
Data collection
It's time to get the data we need from the object above so we can make the status page dynamic. Let's start by getting the website name and URL by accessing the response object:
The date the monitor was created is next. The below code gets the date (a unix timestamp) and formats it into a nicer format using the date function:
Now let's get the overall uptime percentage. The API returns this formatted to 3 decimal points, so i'm using number_format to format it to 2 decimal points as it's a bit nicer to read:
The overall uptime ratio can be used to calculate the overall downtime ratio:
This next part will be used later on. All this is doing is hiding the 'downtime' section of the pie-chart if there has never been any recorded downtime, building the data and setting colours:
The final piece of the puzzle is to get the current status of the website, and change the content shown based on the status:
Creating the status page
That's us done with the PHP logic for the status page. The only thing left to do is to create the actual page to display the content.
I'm using a few different scripts and stylesheets to create and style the status page:
- Bulma: A CSS framework based on Flexbox. This is being used to provide the styling of the page. It's a great lightweight framework, with no JavaScript included.
- Font Awesome: Used to add vector icons.
- Chart.js: A charting library which is used to add the dynamic pie-chart to the page.
Create a file named 'index.php'. At the top of the file we will require the 'monitoring.php' file we just finished up with. This will allow access to all the website data.
In the file, I've created a simple status page. This can be customised as required. I'm pulling in the libraries mentioned above and displaying the data pulled from the monitoring file:
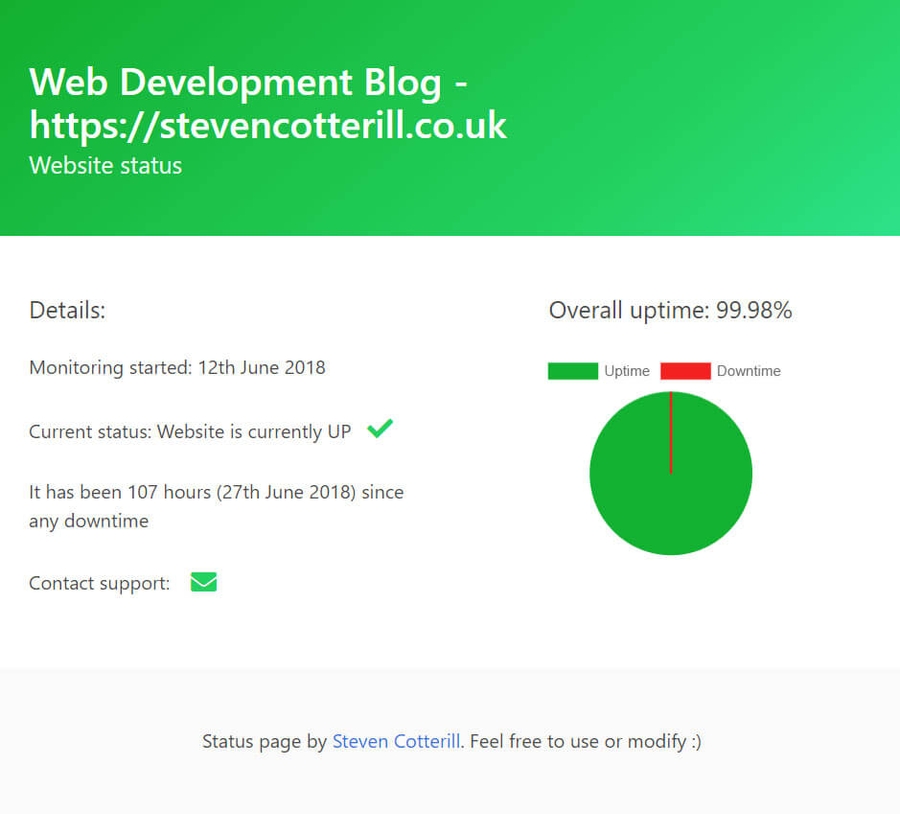
And the end result can be seen below:
Finishing up
That's all there is to it. We've created a nice dynamic status page that changes depending on the current status of the website, and provides a link to contact support. This can be easily implemented into any website; all that needs to be changed is the API key at the top of the monitoring file.
This can be expanded to fit your specific needs. For example, CRON could be used to send monthly emails out to clients detailing their uptime statistics.
I've provided the full source code below, feel free to use or modify the code!


